Organic Chemistry Text Book (CHEM 3401 and 3402)
- Home
-
Chapter 1: A Review of General Chemistry
Toggle Dropdown
- 1.1 Introduction to Organic Chemistry
- 1.2 Electrons, Bonds, and Lewis Structures
- 1.3 Identifying Formal Charges
- 1.4 Atomic Orbitals
- 1.5 Valence Bond Theory
- 1.6 Molecular Orbital Theory/Hybridization
- 1.7 VSEPR Theory: Predicting Geometry
- 1.8 Dipole Moments and Molecular Polarity
- 1.9 Intermolecular Forces and Physical Properties
- Problem Set
- Videos for chapter 1
- Chapter 2: Molecular Representations Toggle Dropdown
- Chapter 3: Acids and Bases Toggle Dropdown
- Chapter 4: Alkanes and Cycloalkanes Toggle Dropdown
- Chapter 5: Stereochemistry Toggle Dropdown
- Chapter 6: Chemical Reactivity and Mechanisms Toggle Dropdown
- Chapter 7: Substitution Reactions Toggle Dropdown
-
Chapter 8: Addition Reactions of Alkenes
Toggle Dropdown
- 8.1 Introduction of Addition Reactions
- 8.1 Nomenclature of Alkenes
- 8.2 Hydrohalogenation of Alkenes
- 8.3 Hydration, Hydroboration, and Oxymercuration of Alkenes
- 8.4 Hydrogenation of Alkenes
- 8.5 Halogenation of Alkenes
- 8.6 Dihydroxylation, Epoxidation, and Ozonolysis of Alkenes
- Problem Set
- Chapter 8 Videos
- Chapter 9: Alkynes Toggle Dropdown
- Chapter 10: Radicals Toggle Dropdown
- Chapter 11: Synthesis Toggle Dropdown
- Problem Sets Organic Chemistry I (CHEM 3401)
-
Chapter 12: Alcohols and Phenols
Toggle Dropdown
- 12.1 Alcohol Structure
- 12.2 Solubility
- 12.3 Boiling Point & Melting Point
- 12.4 Nomenclature
- 12.5 Alcohol Acidity
- 12.6 Reactions of Alcohols and Phenols
- 12.6.1 Substitution of the Hydroxyl Hydrogen
- 12.6.2 Nucleophilic Substitution of the Hydroxyl Group
- 12.6.3 Elimination Reactions of Alcohols
- 12.6.4 Oxidation Reactions of Alcohols
- 12.6.5 Reactions of Phenols
- 12.7 Practice Problems
- 12.7.1 Alcohol Nomenclature 1
- 12.7.2 Alcohol Nomenclature 2
- 12.7.3 Alcohol Nomenclature 3
- 12.7.4 Formation of Carbonyl Compounds
- 12.7.5 Functional Relationships of Alcohols
- 12.7.6 Reactions of Alcohols & Phenols
- 12.7.7 Alcohol Reactions
- Chapter 13: Ethers and Epoxides Toggle Dropdown
-
Chapter 14: Infrared Spectroscopy and Mass Spectrometry
Toggle Dropdown
- 14.1 Introduction fo Molecular Spectroscopy
- 14.2 Infrared Spectroscopy
- 14.2.1 Introduction
- 14.2.2 Vibrational Spectroscopy
- 14.2.3 Group Frequencies
- 14.2.4 Table of Characteristic IR Frequencies
- 14.3 Mass Spectrometry
- 14.3.1 The Mass Spectrometer
- 14.3.2 Characteristics of Mass Spectra
- 14.3.3 Isotopes
- 14.3.4 Fragmentation Patterns
- 14.3.5 High Resolution Spectra
- 14.3.6 MS Practice Problems
- 14.3.6a Problem 1
- 14.3.6b Problem 2
- 14.3.6c Problem 3
- 14.3.6d Problem 4
- 14.3.6e Problem 5
- 14.3.6f Problem 6
- 14.3.6g Problem 7
- 14.3.6h Problem 8
-
Chapter 15: Nuclear Magnetic Resonance Spectroscopy and UV-Visible Spectroscopy
- 15.1 Nuclear Magnetic Resonance Spectroscopy
- 15.1.1 Background
- 15.1.2 Proton NMR Spectroscopy
- 15.1.2a Introduction to Proton NMR Spectroscopy
- 15.1.2b Chemical Shift
- 15.1.2c Signal Strength
- 15.1.2d Hydroxyl Proton Exchange and the Influence of Hydrogen Bonding
- 15.1.2e Pi-Electron Functions
- 15.1.2f Solvent Effects
- 15.1.2g Spin-Spin Interactions
- 15.1.2h Examples
- 15.1.3 Carbon NMR Spectroscopy
- 15.1.4 NMR Practice Problems
- 15.1.4a Problem 1
- 15.1.4b Problem 2
- 15.1.4c Problem 3
- 15.1.4d Problem 4
- 15.1.4e Problem 5
- 15.1.4f Problem 6
- 15.1.4g Problem 7
- 15.1.4h Problem 8
- 15.1.4i Problem 9
- 15.1.4j Problem 10
- 15.1.5 Table of Proton NMR Shifts
- 15.1.6 Table of Carbon NMR Shifts
- 15.2 UV-Visible Spectroscopy
- 15.2.1 Background
- 15.2.2 The Electromagnetic Spectrum
- 15.2.3 UV-Visible Absorption Spectra
- 15.2.4 The Importance of Conjugation
- 15.3 Spectroscopy Practice Problems
- Chapter 16: Conjugated Pi Systems and Pericyclic Reactions Toggle Dropdown
-
Chapter 17: Aromatic Compounds
Toggle Dropdown
- 17.1 Aromaticity
- 17.1.1 Benzene
- 17.1.2 Fused Ring Compounds
- 17.1.3 Other Aromatic Compounds
- 17.1.4 Antiaromaticity
- 17.1.5 Practice Problems
- 17.1.5a Problem 1
- 17.1.5b Problem 2
- 17.2 Reactions of Substituent Groups
- 17.2.1 Oxidation of Alkyl Side-Chains
- 17.2.2 Bromination of Alkyl Side-Chains
- 17.2.3 Reduction of Nitro Groups
- Chapter 17 Videos
-
Chapter 18: Aromatic Substitution Reactions
Toggle Dropdown
- 18.1 Electrophilic Aromatic Substitution Reactions
- 18.2 Electrophilic Aromatic Substitution Mechanism
- 18.3 Electrophilic Aromatic Substitution Activation/Deactivation and Orientation
- 18.4 Electrophilic Substitution of Disubstituted Benzene Rings
- 18.5 Practice Problems
- 18.5.1 Problem 1
- 18.5.2 Problem 2
- 18.5.3 Problem 3
- 18.5.4 Problem 4
- 18.5.5 Problem 5
- 18.5.6 Problem 6
- 18.5.7 Problem 7
- Chapter 18 Videos
-
Chapter 19: Aldehydes and Ketones
Toggle Dropdown
- 19.1 Nomenclature
- 19.2 Preparation of Aldehydes and Ketones
- 19.3 Properties of Aldehydes and Ketones
- 19.4 Reactions of Aldehydes and Ketones
- 19.4.1 Addition Reactions
- 19.4.1a Hydration
- 19.4.1b Acetal Formation
- 19.4.1c Imine Formation
- 19.4.1d Cyanohydrin Formation
- 19.4.1e Hydride Reduction
- 19.4.1f Addition of Organometallic Reagents
- 19.4.2 Reduction of Aldehydes and Ketones
- 19.4.2a Wolff-Kishner Reduction
- 19.4.2b Clemmensen Reduction
- 19.4.3 Oxidation of Aldehydes and Ketones
- 19.5 Practice Problems
- 19.5.1 Problem 1
- 19.5.2 Problem 2
- 19.5.3 Problem 3
- 19.5.4 Problem 4
- 19.5.5 Problem 5
- 19.5.6 Problem 6
- 19.5.7 Problem 7
- 19.5.8 Problem 8
- 19.5.9 Problem 9
- 19.5.10 Problem 10
- 19.5.11 Problem 11
- 19.5.12 Problem 12
-
Chapter 20: Carboxylic Acids and Their Derivatives
Toggle Dropdown
- 20.1 Nomenclature
- 20.2 Physical Properties
- 20.3 Acidity
- 20.4 Preparation of Carboxylic Acids
- 20.5 Reactions of Carboxylic Acids
- 20.5.1 Salt Formation
- 20.5.2 Substitution of the Hydroxyl Hydrogen
- 20.5.3 Substitution of the Hydroxyl Group
- 20.5.4 Reduction
- 20.5.5 Oxidation
- 20.6 Practice Problems-Carboxylic Acids
- 20.6.1 Nomenclature Practice-1
- 20.6.2 Nomenclature Practice-2
- 20.6.3 Acidity
- 20.6.4 Reactions of Carboxylic Acids
- 20.7 Carboxylic Acid Derivatives
- 20.7.1 Related Derivatives
- 20.7.2 Nomenclature
- 20.7.3 Reactions
- 20.7.3a Acyl Substitution
- 20.7.3b Nitrile Hydrolysis
- 20.7.3c Reductions
- 20.7.3d Reactions with Organometallic Reagents
- 20.7.3e Dehydration of Amides
- 20.7.4 Practice Problems-Carboxylic Acid Derivatives
- 20.7.4a Nomenclature Practice-1
- 20.7.4b Nomenclature Practice-2
- 20.7.4c Carbonyl Compounds
- 20.8 Practice Problems
- 20.8.1 Problem 1
- 20.8.2 Problem 2
- 20.8.3 Problem 3
- 20.8.4 Problem 4
- 20.8.5 Problem 5
- 20.8.6 Problem 6
-
Chapter 21: Alpha Carbon Chemistry: Enols and Enolates
Toggle Dropdown
- 21.1 Reactions at the Alpha Carbon
- 21.2 Alpha Halogenation of Enols and Enolates
- 21.3 Aldol Reaction
- 21.4 Claisen Condensation
- 21.5 Alkylation at the Alpha Position
- 21.5.1 Enolate Alkylation
- 21.5.2 Dicarbonyl Alkylation
- 21.5.3 Decarboxylation Following Alkylation
- 21.5.4 Conjugate Reactions
- 21.5.4a Michael Reaction
- 21.5.4b Robinson Annulation
- 21.5.4c With Hydrides and Organometallics
- 21.6 Practice Problem
- 21.6.1 Problem 1
- Org Chem II - Problem Sets - Collection (CHEM 3402)
- Problem Set
15.1.3 Carbon NMR Spectroscopy
The power and usefulness of 1H nmr spectroscopy as a tool for structural analysis should be evident from the past discussion. Unfortunately, when significant portions of a molecule lack C-H bonds, no information is forthcoming. Examples include polychlorinated compounds such as chlordane, polycarbonyl compounds such as croconic acid, and compounds incorporating triple bonds (structures below, orange colored carbons).

Even when numerous C-H groups are present, an unambiguous interpretation of a proton nmr spectrum may not be possible. The following diagram depicts three pairs of isomers (A & B) which display similar proton nmr spectra. Although a careful determination of chemical shifts should permit the first pair of compounds (blue box) to be distinguished, the second and third cases (red & green boxes) might be difficult to identify by proton nmr alone.

These difficulties would be largely resolved if the carbon atoms of a molecule could be probed by nmr in the same fashion as the hydrogen atoms. Since the major isotope of carbon (12C) has no spin, this option seems unrealistic. Fortunately, 1.1% of elemental carbon is the 13C isotope, which has a spin I = 1/2, so in principle it should be possible to conduct a carbon nmr experiment. It is worth noting here, that if much higher abundances of 13C were naturally present in all carbon compounds, proton nmr would become much more complicated due to large one-bond coupling of 13C and 1H.
|
Many obstacles needed to be overcome before carbon nmr emerged as a routine tool : |
The most important operational technique that has led to successful and routine 13C nmr spectroscopy is the use of high-field pulse technology coupled with broad-band heteronuclear decouplingof all protons. The results of repeated pulse sequences are accumulated to provide improved signal strength. Also, for reasons that go beyond the present treatment, the decoupling irradiation enhances the sensitivity of carbon nuclei bonded to hydrogen.
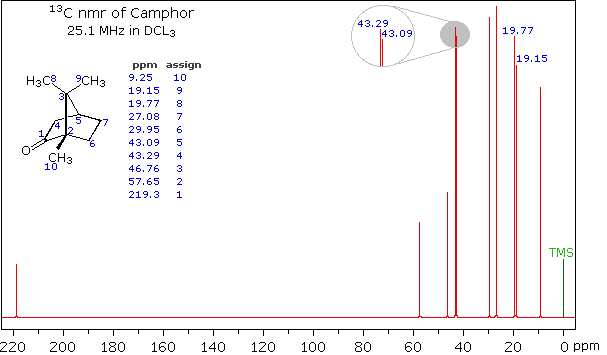
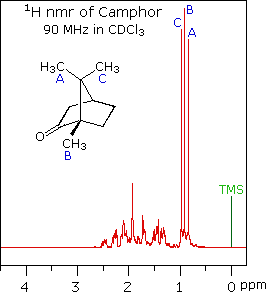
When acquired in this manner, the carbon nmr spectrum of a compound displays a single sharp signal for each structurally distinct carbon atom in a molecule (remember, the proton couplings have been removed). The spectrum of camphor, shown on the left below, is typical. Furthermore, a comparison with the 1H nmr spectrum on the right illustrates some of the advantageous characteristics of carbon nmr. The dispersion of 13C chemical shifts is nearly twenty times greater than that for protons, and this together with the lack of signal splitting makes it more likely that every structurally distinct carbon atom will produce a separate signal. The only clearly identifiable signals in the proton spectrum are those from the methyl groups. The remaining protons have resonance signals between 1.0 and 2.8 ppm from TMS, and they overlap badly thanks to spin-spin splitting.
 |
 |
|---|
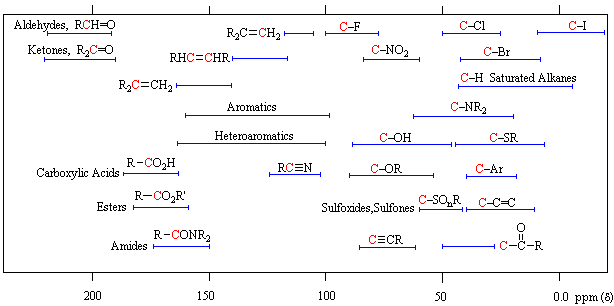
Unlike proton nmr spectroscopy, the relative strength of carbon nmr signals are not normally proportional to the number of atoms generating each one. Because of this, the number of discrete signals and their chemical shifts are the most important pieces of evidence delivered by a carbon spectrum. The general distribution of carbon chemical shifts associated with different functional groups is summarized in the following chart. Bear in mind that these ranges are approximate, and may not encompass all compounds of a given class. Note also that the over 200 ppm range of chemical shifts shown here is much greater than that observed for proton chemical shifts.
13C Chemical Shift Ranges* |
||
|---|---|---|
| Low Field Region |
|
High Field Region |
| * For samples in CDCl3 solution. The δ scale is relative to TMS at δ=0. | ||
The isomeric pairs previously cited as giving very similar proton nmr spectra are now seen to be distinguished by carbon nmr. In the example on the left below (blue box), cyclohexane and 2,3-dimethyl-2-butene both give a single sharp resonance signal in the proton nmr spectrum (the former at δ 1.43 ppm and the latter at 1.64 ppm). However, in its carbon nmr spectrum cyclohexane displays a single signal at δ 27.1 ppm, generated by the equivalent ring carbon atoms (colored blue); whereas the isomeric alkene shows two signals, one at δ 20.4 ppm from the methyl carbons (colored brown), and the other at 123.5 ppm (typical of the green colored sp2 hybrid carbon atoms).

The C8H10 isomers in the center (red) box have pairs of homotopic carbons and hydrogens, so symmetry should simplify their nmr spectra. The fulvene (isomer A) has five structurally different groups of carbon atoms (colored brown, magenta, orange, blue and green respectively) and should display five 13C nmr signals (one near 20 ppm and the other four greater than 100 ppm). Although ortho-xylene (isomer B) will have a proton nmr very similar to isomer A, it should only display four 13C nmr signals, originating from the four different groups of carbon atoms (colored brown, blue, orange and green). The methyl carbon signal will appear at high field (near 20 ppm), and the aromatic ring carbons will all give signals having δ > 100 ppm. Finally, the last isomeric pair, quinones A & B in the green box, are easily distinguished by carbon nmr. Isomer A displays only four carbon nmr signals (δ 15.4, 133.4, 145.8 & 187.9 ppm); whereas, isomer B displays five signals (δ 15.9, 133.3, 145.8, 187.5 & 188.1 ppm), the additional signal coming from the non-identity of the two carbonyl carbon atoms (one colored orange and the other magenta).
|
Variations of the 13C nmr procedure described here can provide additional structural information. |
|---|

