Organic Chemistry Text Book (CHEM 3401 and 3402)
- Home
- Chapter 1: A Review of General ChemistryToggle Dropdown
- 1.1 Introduction to Organic Chemistry
- 1.2 Electrons, Bonds, and Lewis Structures
- 1.3 Identifying Formal Charges
- 1.4 Atomic Orbitals
- 1.5 Valence Bond Theory
- 1.6 Molecular Orbital Theory/Hybridization
- 1.7 VSEPR Theory: Predicting Geometry
- 1.8 Dipole Moments and Molecular Polarity
- 1.9 Intermolecular Forces and Physical Properties
- Problem Set
- Videos for chapter 1
- Chapter 2: Molecular RepresentationsToggle Dropdown
- Chapter 3: Acids and BasesToggle Dropdown
- Chapter 4: Alkanes and CycloalkanesToggle Dropdown
- Chapter 5: StereochemistryToggle Dropdown
- Chapter 6: Chemical Reactivity and MechanismsToggle Dropdown
- Chapter 7: Substitution ReactionsToggle Dropdown
- Chapter 8: Addition Reactions of AlkenesToggle Dropdown
- 8.1 Introduction of Addition Reactions
- 8.1 Nomenclature of Alkenes
- 8.2 Hydrohalogenation of Alkenes
- 8.3 Hydration, Hydroboration, and Oxymercuration of Alkenes
- 8.4 Hydrogenation of Alkenes
- 8.5 Halogenation of Alkenes
- 8.6 Dihydroxylation, Epoxidation, and Ozonolysis of Alkenes
- Problem Set
- Chapter 8 Videos
- Chapter 9: AlkynesToggle Dropdown
- Chapter 10: RadicalsToggle Dropdown
- Chapter 11: SynthesisToggle Dropdown
- Problem Sets Organic Chemistry I (CHEM 3401)
- Chapter 12: Alcohols and PhenolsToggle Dropdown
- 12.1 Alcohol Structure
- 12.2 Solubility
- 12.3 Boiling Point & Melting Point
- 12.4 Nomenclature
- 12.5 Alcohol Acidity
- 12.6 Reactions of Alcohols and Phenols
- 12.6.1 Substitution of the Hydroxyl Hydrogen
- 12.6.2 Nucleophilic Substitution of the Hydroxyl Group
- 12.6.3 Elimination Reactions of Alcohols
- 12.6.4 Oxidation Reactions of Alcohols
- 12.6.5 Reactions of Phenols
- 12.7 Practice Problems
- 12.7.1 Alcohol Nomenclature 1
- 12.7.2 Alcohol Nomenclature 2
- 12.7.3 Alcohol Nomenclature 3
- 12.7.4 Formation of Carbonyl Compounds
- 12.7.5 Functional Relationships of Alcohols
- 12.7.6 Reactions of Alcohols & Phenols
- 12.7.7 Alcohol Reactions
- Chapter 13: Ethers and EpoxidesToggle Dropdown
- Chapter 14: Infrared Spectroscopy and Mass SpectrometryToggle Dropdown
- 14.1 Introduction fo Molecular Spectroscopy
- 14.2 Infrared Spectroscopy
- 14.2.1 Introduction
- 14.2.2 Vibrational Spectroscopy
- 14.2.3 Group Frequencies
- 14.2.4 Table of Characteristic IR Frequencies
- 14.3 Mass Spectrometry
- 14.3.1 The Mass Spectrometer
- 14.3.2 Characteristics of Mass Spectra
- 14.3.3 Isotopes
- 14.3.4 Fragmentation Patterns
- 14.3.5 High Resolution Spectra
- 14.3.6 MS Practice Problems
- 14.3.6a Problem 1
- 14.3.6b Problem 2
- 14.3.6c Problem 3
- 14.3.6d Problem 4
- 14.3.6e Problem 5
- 14.3.6f Problem 6
- 14.3.6g Problem 7
- 14.3.6h Problem 8
- Chapter 15: Nuclear Magnetic Resonance Spectroscopy and UV-Visible Spectroscopy
- 15.1 Nuclear Magnetic Resonance Spectroscopy
- 15.1.1 Background
- 15.1.2 Proton NMR Spectroscopy
- 15.1.2a Introduction to Proton NMR Spectroscopy
- 15.1.2b Chemical Shift
- 15.1.2c Signal Strength
- 15.1.2d Hydroxyl Proton Exchange and the Influence of Hydrogen Bonding
- 15.1.2e Pi-Electron Functions
- 15.1.2f Solvent Effects
- 15.1.2g Spin-Spin Interactions
- 15.1.2h Examples
- 15.1.3 Carbon NMR Spectroscopy
- 15.1.4 NMR Practice Problems
- 15.1.4a Problem 1
- 15.1.4b Problem 2
- 15.1.4c Problem 3
- 15.1.4d Problem 4
- 15.1.4e Problem 5
- 15.1.4f Problem 6
- 15.1.4g Problem 7
- 15.1.4h Problem 8
- 15.1.4i Problem 9
- 15.1.4j Problem 10
- 15.1.5 Table of Proton NMR Shifts
- 15.1.6 Table of Carbon NMR Shifts
- 15.2 UV-Visible Spectroscopy
- 15.2.1 Background
- 15.2.2 The Electromagnetic Spectrum
- 15.2.3 UV-Visible Absorption Spectra
- 15.2.4 The Importance of Conjugation
- 15.3 Spectroscopy Practice Problems
- Chapter 16: Conjugated Pi Systems and Pericyclic ReactionsToggle Dropdown
- Chapter 17: Aromatic CompoundsToggle Dropdown
- 17.1 Aromaticity
- 17.1.1 Benzene
- 17.1.2 Fused Ring Compounds
- 17.1.3 Other Aromatic Compounds
- 17.1.4 Antiaromaticity
- 17.1.5 Practice Problems
- 17.1.5a Problem 1
- 17.1.5b Problem 2
- 17.2 Reactions of Substituent Groups
- 17.2.1 Oxidation of Alkyl Side-Chains
- 17.2.2 Bromination of Alkyl Side-Chains
- 17.2.3 Reduction of Nitro Groups
- Chapter 17 Videos
- Chapter 18: Aromatic Substitution ReactionsToggle Dropdown
- 18.1 Electrophilic Aromatic Substitution Reactions
- 18.2 Electrophilic Aromatic Substitution Mechanism
- 18.3 Electrophilic Aromatic Substitution Activation/Deactivation and Orientation
- 18.4 Electrophilic Substitution of Disubstituted Benzene Rings
- 18.5 Practice Problems
- 18.5.1 Problem 1
- 18.5.2 Problem 2
- 18.5.3 Problem 3
- 18.5.4 Problem 4
- 18.5.5 Problem 5
- 18.5.6 Problem 6
- 18.5.7 Problem 7
- Chapter 18 Videos
- Chapter 19: Aldehydes and KetonesToggle Dropdown
- 19.1 Nomenclature
- 19.2 Preparation of Aldehydes and Ketones
- 19.3 Properties of Aldehydes and Ketones
- 19.4 Reactions of Aldehydes and Ketones
- 19.4.1 Addition Reactions
- 19.4.1a Hydration
- 19.4.1b Acetal Formation
- 19.4.1c Imine Formation
- 19.4.1d Cyanohydrin Formation
- 19.4.1e Hydride Reduction
- 19.4.1f Addition of Organometallic Reagents
- 19.4.2 Reduction of Aldehydes and Ketones
- 19.4.2a Wolff-Kishner Reduction
- 19.4.2b Clemmensen Reduction
- 19.4.3 Oxidation of Aldehydes and Ketones
- 19.5 Practice Problems
- 19.5.1 Problem 1
- 19.5.2 Problem 2
- 19.5.3 Problem 3
- 19.5.4 Problem 4
- 19.5.5 Problem 5
- 19.5.6 Problem 6
- 19.5.7 Problem 7
- 19.5.8 Problem 8
- 19.5.9 Problem 9
- 19.5.10 Problem 10
- 19.5.11 Problem 11
- 19.5.12 Problem 12
- Chapter 20: Carboxylic Acids and Their DerivativesToggle Dropdown
- 20.1 Nomenclature
- 20.2 Physical Properties
- 20.3 Acidity
- 20.4 Preparation of Carboxylic Acids
- 20.5 Reactions of Carboxylic Acids
- 20.5.1 Salt Formation
- 20.5.2 Substitution of the Hydroxyl Hydrogen
- 20.5.3 Substitution of the Hydroxyl Group
- 20.5.4 Reduction
- 20.5.5 Oxidation
- 20.6 Practice Problems-Carboxylic Acids
- 20.6.1 Nomenclature Practice-1
- 20.6.2 Nomenclature Practice-2
- 20.6.3 Acidity
- 20.6.4 Reactions of Carboxylic Acids
- 20.7 Carboxylic Acid Derivatives
- 20.7.1 Related Derivatives
- 20.7.2 Nomenclature
- 20.7.3 Reactions
- 20.7.3a Acyl Substitution
- 20.7.3b Nitrile Hydrolysis
- 20.7.3c Reductions
- 20.7.3d Reactions with Organometallic Reagents
- 20.7.3e Dehydration of Amides
- 20.7.4 Practice Problems-Carboxylic Acid Derivatives
- 20.7.4a Nomenclature Practice-1
- 20.7.4b Nomenclature Practice-2
- 20.7.4c Carbonyl Compounds
- 20.8 Practice Problems
- 20.8.1 Problem 1
- 20.8.2 Problem 2
- 20.8.3 Problem 3
- 20.8.4 Problem 4
- 20.8.5 Problem 5
- 20.8.6 Problem 6
- Chapter 21: Alpha Carbon Chemistry: Enols and EnolatesToggle Dropdown
- 21.1 Reactions at the Alpha Carbon
- 21.2 Alpha Halogenation of Enols and Enolates
- 21.3 Aldol Reaction
- 21.4 Claisen Condensation
- 21.5 Alkylation at the Alpha Position
- 21.5.1 Enolate Alkylation
- 21.5.2 Dicarbonyl Alkylation
- 21.5.3 Decarboxylation Following Alkylation
- 21.5.4 Conjugate Reactions
- 21.5.4a Michael Reaction
- 21.5.4b Robinson Annulation
- 21.5.4c With Hydrides and Organometallics
- 21.6 Practice Problem
- 21.6.1 Problem 1
- Org Chem II - Problem Sets - Collection (CHEM 3402)
- Problem Set
15.1.2a Introduction to Proton NMR Spectroscopy
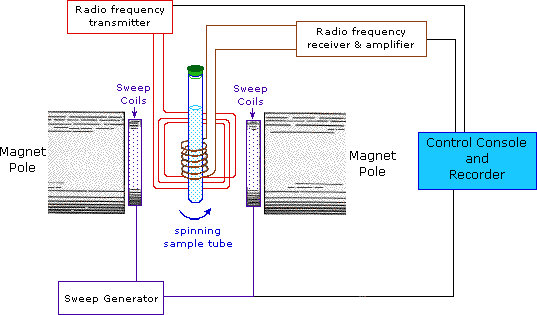
This important and well-established application of nuclear magnetic resonance will serve to illustrate some of the novel aspects of this method. To begin with, the nmr spectrometer must be tuned to a specific nucleus, in this case the proton. The actual procedure for obtaining the spectrum varies, but the simplest is referred to as the continuous wave (CW) method. A typical CW-spectrometer is shown in the following diagram. A solution of the sample in a uniform 5 mm glass tube is oriented between the poles of a powerful magnet, and is spun to average any magnetic field variations, as well as tube imperfections. Radio frequency radiation of appropriate energy is broadcast into the sample from an antenna coil (colored red). A receiver coil surrounds the sample tube, and emission of absorbed rf energy is monitored by dedicated electronic devices and a computer. An nmr spectrum is acquired by varying or sweeping the magnetic field over a small range while observing the rf signal from the sample. An equally effective technique is to vary the frequency of the rf radiation while holding the external field constant.
|
For a description of the pulse Fourier transform technique, preferred by most spectroscopists over the older CW method, Click Here. |
|---|

As an example, consider a sample of water in a 2.3487 T external magnetic field, irradiated by 100 MHz radiation. If the magnetic field is smoothly increased to 2.3488 T, the hydrogen nuclei of the water molecules will at some point absorb rf energy and a resonance signal will appear. An animation showing this may be activated by clicking the Show Field Sweep button. The field sweep will be repeated three times, and the resulting resonance trace is colored red. For visibility, the water proton signal displayed in the animation is much broader than it would be in an actual experiment.

Since protons all have the same magnetic moment, we might expect all hydrogen atoms to give resonance signals at the same field / frequency values. Fortunately for chemistry applications, this is not true. By clicking the Show Different Protons button under the diagram, a number of representative proton signals will be displayed over the same magnetic field range. It is not possible, of course, to examine isolated protons in the spectrometer described above; but from independent measurement and calculation it has been determined that a naked proton would resonate at a lower field strength than the nuclei of covalently bonded hydrogens. With the exception of water, chloroform and sulfuric acid, which are examined as liquids, all the other compounds are measured as gases.

Why should the proton nuclei in different compounds behave differently in the nmr experiment ?
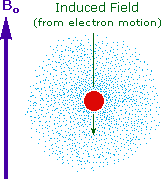
The answer to this question lies with the electron(s) surrounding the proton in covalent compounds and ions. Since electrons are charged particles, they move in response to the external magnetic field (Bo) so as to generate a secondary field that opposes the much stronger applied field. This secondary field shields the nucleus from the applied field, so Bo must be increased in order to achieve resonance (absorption of rf energy). As illustrated in the drawing on the right, Bo must be increased to compensate for the induced shielding field. In the upper diagram, those compounds that give resonance signals at the higher field side of the diagram (CH4, HCl, HBr and HI) have proton nuclei that are more shielded than those on the lower field (left) side of the diagram.
The magnetic field range displayed in the above diagram is very small compared with the actual field strength (only about 0.0042%). It is customary to refer to small increments such as this in units of parts per million (ppm). The difference between 2.3487 T and 2.3488 T is therefore about 42 ppm. Instead of designating a range of nmr signals in terms of magnetic field differences (as above), it is more common to use a frequency scale, even though the spectrometer may operate by sweeping the magnetic field. Using this terminology, we would find that at 2.34 T the proton signals shown above extend over a 4,200 Hz range (for a 100 MHz rf frequency, 42 ppm is 4,200 Hz). Most organic compounds exhibit proton resonances that fall within a 12 ppm range (the shaded area), and it is therefore necessary to use very sensitive and precise spectrometers to resolve structurally distinct sets of hydrogen atoms within this narrow range. In this respect it might be noted that the detection of a part-per-million difference is equivalent to detecting a 1 millimeter difference in distances of 1 kilometer.
