
Chemistry Textbook
Phase Transitions
- Define phase transitions and phase transition temperatures
- Explain the relation between phase transition temperatures and intermolecular attractive forces
- Describe the processes represented by typical heating and cooling curves, and compute heat flows and enthalpy changes accompanying these processes
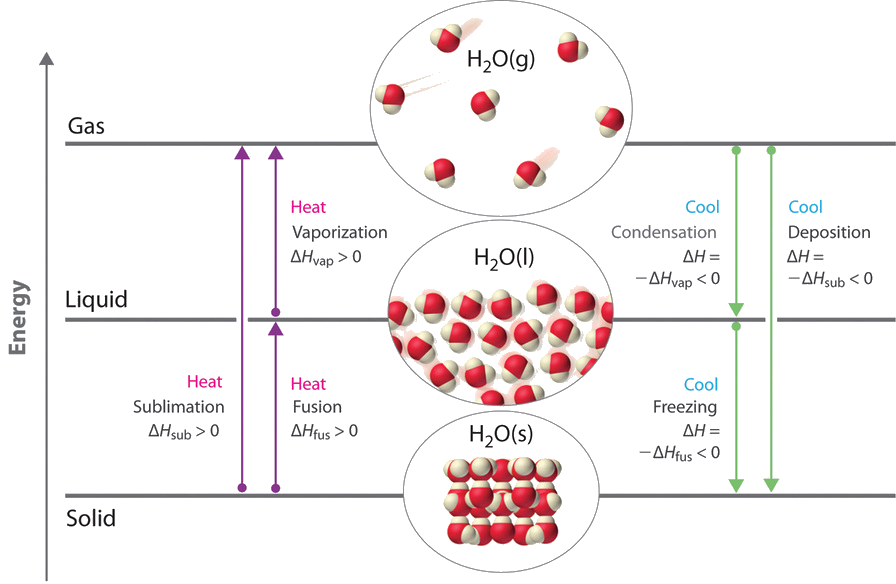
We witness and utilize changes of physical state, or phase transitions, in a great number of ways. As one example of global significance, consider the evaporation, condensation, freezing, and melting of water. These changes of state are essential aspects of our earth’s water cycle as well as many other natural phenomena and technological processes of central importance to our lives. In this module, the essential aspects of phase transitions are explored. The six most common phase changes are shown in Figure 8.10.
Vaporization and Condensation
When a liquid vaporizes in a closed container, gas molecules cannot escape. As these gas phase molecules move randomly about, they will occasionally collide with the surface of the condensed phase, and in some cases, these collisions will result in the molecules re-entering the condensed phase. The change from the gas phase to the liquid is called condensation.
When the rate of condensation becomes equal to the rate of vaporization, neither the amount of the liquid nor the amount of the vapor in the container changes. The vapor in the container is then said to be in equilibrium with the liquid. Keep in mind that this is not a static situation, as molecules are continually exchanged between the condensed and gaseous phases. Such is an example of a dynamic equilibrium, the status of a system in which reciprocal processes (for example, vaporization and condensation) occur at equal rates. The pressure exerted by the vapor in equilibrium with a liquid in a closed container at a given temperature is called the liquid’s vapor pressure (or equilibrium vapor pressure). The area of the surface of the liquid in contact with a vapor and the size of the vessel have no effect on the vapor pressure, although they do affect the time required for the equilibrium to be reached.
The chemical identities of the molecules in a liquid determine the types (and strengths) of intermolecular attractions possible; consequently, different substances will exhibit different equilibrium vapor pressures. Relatively strong intermolecular attractive forces will serve to impede vaporization as well as favoring “recapture” of gas-phase molecules when they collide with the liquid surface, resulting in a relatively low vapor pressure. Weak intermolecular attractions present less of a barrier to vaporization, and a reduced likelihood of gas recapture, yielding relatively high vapor pressures. The following example illustrates this dependence of vapor pressure on intermolecular attractive forces.
Explaining Vapor Pressure in Terms of IMFs
Given the shown structural formulas for these four compounds, explain their relative vapor pressures in terms of types and extents of IMFs:

Solution:
Diethyl ether has a very small dipole and most of its intermolecular attractions are London forces. Although this molecule is the largest of the four under consideration, its IMFs are the weakest and, as a result, its molecules most readily escape from the liquid. It also has the highest vapor pressure. Due to its smaller size, ethanol exhibits weaker dispersion forces than diethyl ether. However, ethanol is capable of hydrogen bonding and, therefore, exhibits stronger overall IMFs, which means that fewer molecules escape from the liquid at any given temperature, and so ethanol has a lower vapor pressure than diethyl ether. Water is much smaller than either of the previous substances and exhibits weaker dispersion forces, but its extensive hydrogen bonding provides stronger intermolecular attractions, fewer molecules escaping the liquid, and a lower vapor pressure than for either diethyl ether or ethanol. Ethylene glycol has two −OH groups, so, like water, it exhibits extensive hydrogen bonding. It is much larger than water and thus experiences larger London forces. Its overall IMFs are the largest of these four substances, which means its vaporization rate will be the slowest and, consequently, its vapor pressure the lowest.
Check Your Learning:
At 20 °C, the vapor pressures of several alcohols are given in this table. Explain these vapor pressures in terms of types and extents of IMFs for these alcohols:
| Compound | methanol CH3OH | ethanol C2H5OH | propanol C3H7OH | butanol C4H9OH |
| Vapor Pressure at 20 °C | 11.9 kPa | 5.95 kPa | 2.67 kPa | 0.56 kPa |
Pmethanol > Pethanol > Ppropanol > Pbutanol.
Boiling Points
When the vapor pressure increases enough to equal the external atmospheric pressure, the liquid reaches its boiling point. The boiling point of a liquid is the temperature at which its equilibrium vapor pressure is equal to the pressure exerted on the liquid by its gaseous surroundings. For liquids in open containers, this pressure is that due to the earth’s atmosphere. The normal boiling point of a liquid is defined as its boiling point when surrounding pressure is equal to 1 atm (101.3 kPa). Figure 8.11 shows the variation in vapor pressure with temperature for several different substances. Considering the definition of boiling point, these curves may be seen as depicting the dependence of a liquid’s boiling point on surrounding pressure.

Enthalpy of Vaporization
Vaporization is an endothermic process. The cooling effect can be evident when you leave a swimming pool or a shower. When the water on your skin evaporates, it removes heat from your skin and causes you to feel cold. The energy change associated with the vaporization process is the enthalpy of vaporization, ΔHvap. For example, the vaporization of water at standard temperature is represented by:
As described in the chapter on thermochemistry, the reverse of an endothermic process is exothermic. And so, the condensation of a gas releases heat:
Using Enthalpy of Vaporization
One way our body is cooled is by evaporation of the water in sweat Figure 8.12. In very hot climates, we can lose as much as 1.5 L of sweat per day. Although sweat is not pure water, we can get an approximate value of the amount of heat removed by evaporation by assuming that it is. How much heat is required to evaporate 1.5 L of water (1.5 kg) at T = 37 °C (normal body temperature); ΔHvap = 43.46 kJ/mol at 37 °C.

Solution:
We start with the known volume of sweat (approximated as just water) and use the given information to convert to the amount of heat needed:
Thus, 3600 kJ of heat are removed by the evaporation of 1.5 L of water.
Check Your Learning:
How much heat is required to evaporate 100.0 g of liquid ammonia, NH3, at its boiling point if its enthalpy of vaporization is 4.8 kJ/mol?
Melting and Freezing
When we heat a crystalline solid, we increase the average energy of its atoms, molecules, or ions and the solid gets hotter. At some point, the added energy becomes large enough to partially overcome the forces holding the molecules or ions of the solid in their fixed positions, and the solid begins the process of transitioning to the liquid state, or melting. At this point, the temperature of the solid stops rising, despite the continual input of heat, and it remains constant until all of the solid is melted. Only after all of the solid has melted will continued heating increase the temperature of the liquid Figure 8.13.

If we stop heating during melting and place the mixture of solid and liquid in a perfectly insulated container so no heat can enter or escape, the solid and liquid phases remain in equilibrium. This is almost the situation with a mixture of ice and water in a very good thermos bottle; almost no heat gets in or out, and the mixture of solid ice and liquid water remains for hours. In a mixture of solid and liquid at equilibrium, the reciprocal processes of melting and freezing occur at equal rates, and the quantities of solid and liquid therefore remain constant. The temperature at which the solid and liquid phases of a given substance are in equilibrium is called the melting point of the solid or the freezing point of the liquid. Use of one term or the other is normally dictated by the direction of the phase transition being considered, for example, solid to liquid (melting) or liquid to solid (freezing).
The enthalpy of fusion and the melting point of a crystalline solid depend on the strength of the attractive forces between the units present in the crystal. Molecules with weak attractive forces form crystals with low melting points. Crystals consisting of particles with stronger attractive forces melt at higher temperatures.
The amount of heat required to change one mole of a substance from the solid state to the liquid state is the enthalpy of fusion, ΔHfus of the substance. The enthalpy of fusion of ice is 6.0 kJ/mol at 0 °C. Fusion (melting) is an endothermic process:
The reciprocal process, freezing, is an exothermic process whose enthalpy change is −6.0 kJ/mol at 0 °C:
Sublimation and Deposition
Some solids can transition directly into the gaseous state, bypassing the liquid state, via a process known as sublimation. At room temperature and standard pressure, a piece of dry ice (solid CO2) sublimes, appearing to gradually disappear without ever forming any liquid. Snow and ice sublime at temperatures below the melting point of water, a slow process that may be accelerated by winds and the reduced atmospheric pressures at high altitudes. When solid iodine is warmed, the solid sublimes and a vivid purple vapor forms (Figure 8.14). The reverse of sublimation is called deposition, a process in which gaseous substances condense directly into the solid state, bypassing the liquid state. The formation of frost is an example of deposition.

Like vaporization, the process of sublimation requires an input of energy to overcome intermolecular attractions. The enthalpy of sublimation, ΔHsub, is the energy required to convert one mole of a substance from the solid to the gaseous state. For example, the sublimation of carbon dioxide is represented by:
Likewise, the enthalpy change for the reverse process of deposition is equal in magnitude but opposite in sign to that for sublimation:
Consider the extent to which intermolecular attractions must be overcome to achieve a given phase transition. Converting a solid into a liquid requires that these attractions be only partially overcome; transition to the gaseous state requires that they be completely overcome. As a result, the enthalpy of fusion for a substance is less than its enthalpy of vaporization. This same logic can be used to derive an approximate relation between the enthalpies of all phase changes for a given substance. Though not an entirely accurate description, sublimation may be conveniently modeled as a sequential two-step process of melting followed by vaporization in order to apply Hess’s Law. Viewed in this manner, the enthalpy of sublimation for a substance may be estimated as the sum of its enthalpies of fusion and vaporization, as illustrated in Figure 8.15.
For example:
Heating and Cooling Curves
In the chapter on thermochemistry, the relation between the amount of heat absorbed or released by a substance, q, and its accompanying temperature change, ΔT, was introduced:
where m is the mass of the substance and c is its specific heat. The relation applies to matter being heated or cooled, but not undergoing a change in state. When a substance being heated or cooled reaches a temperature corresponding to one of its phase transitions, further gain or loss of heat is a result of diminishing or enhancing intermolecular attractions, instead of increasing or decreasing molecular kinetic energies. While a substance is undergoing a change in state, its temperature remains constant. Figure 8.16 shows a typical heating curve.
Consider the example of heating a pot of water to boiling. A stove burner will supply heat at a roughly constant rate; initially, this heat serves to increase the water’s temperature. When the water reaches its boiling point, the temperature remains constant despite the continued input of heat from the stove burner. This same temperature is maintained by the water as long as it is boiling. If the burner setting is increased to provide heat at a greater rate, the water temperature does not rise, but instead the boiling becomes more vigorous (rapid). This behavior is observed for other phase transitions as well: For example, temperature remains constant while the change of state is in progress.

Total Heat Needed to Change Temperature and Phase for a Substance How much heat is required to convert 135 g of ice at −15 °C into water vapor at 120 °C?
Solution:
The transition described involves the following steps:
- Heat ice from −15 °C to 0 °C
- Melt ice
- Heat water from 0 °C to 100 °C
- Boil water
- Heat steam from 100 °C to 120 °C
The heat needed to change the temperature of a given substance (with no change in phase) is: q = m c ΔT (see previous chapter on thermochemistry). The heat needed to induce a given change in phase is given by q = n ΔH.
Using these equations with the appropriate values for specific heat of ice, water, and steam, and enthalpies of fusion and vaporization, we have:
Converting the quantities in J to kJ permits them to be summed, yielding the total heat required:
Check Your Learning:
What is the total amount of heat released when 94.0 g water at 80.0 °C cools to form ice at −30.0 °C?